HNI Overview
The HNI was developed in a unique collaboration between the Indiana University Lilly Family School of Philanthropy and The Salvation Army. It provides an analysis of The Salvation Army’s rich, enduring, and consistent collection of service data to expand the pathways through which individuals and communities in poverty may be identified. When combined with an assessment of governmental data, the HNI provides a new lens through which to understand human need across the U.S.
Unlike other traditional measures of poverty, the HNI comprises indicators that represent need substantiated on consumption rather than income. Thus, the HNI’s greatest strength is that it illustrates a more intimate portrayal of need than any other index.
Another important contribution of the HNI is that it provides a reliable instrument for measuring human need in near real time, and for tracking trends over time.
The advantage of this approach is that it provides critical observations informing the work of nonprofit organizations and public policymakers in reducing poverty.
Interactive Timeline
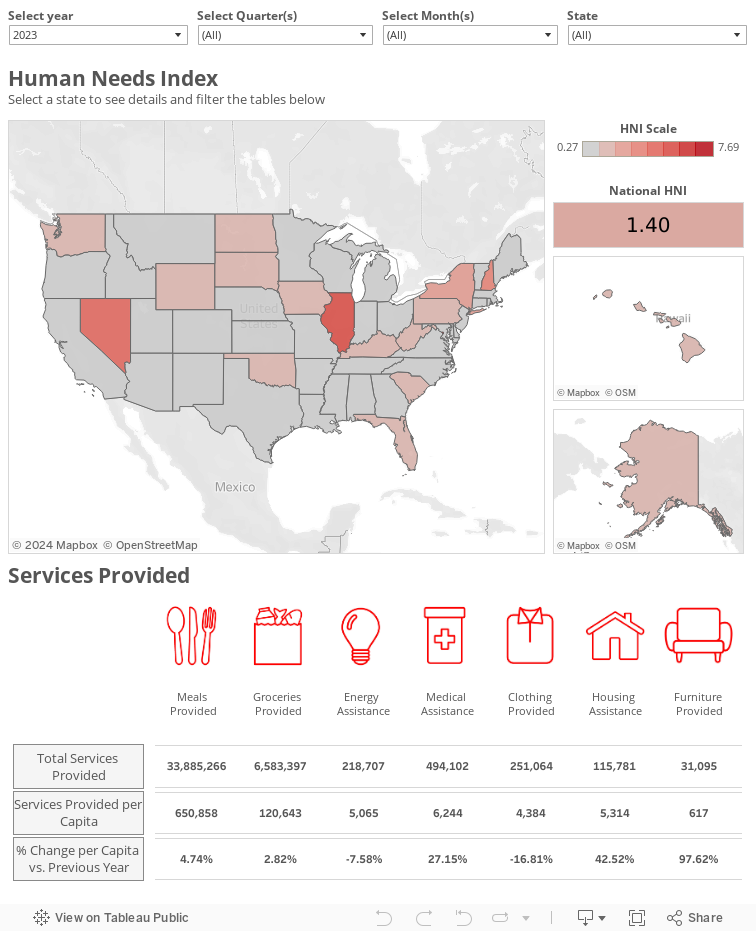
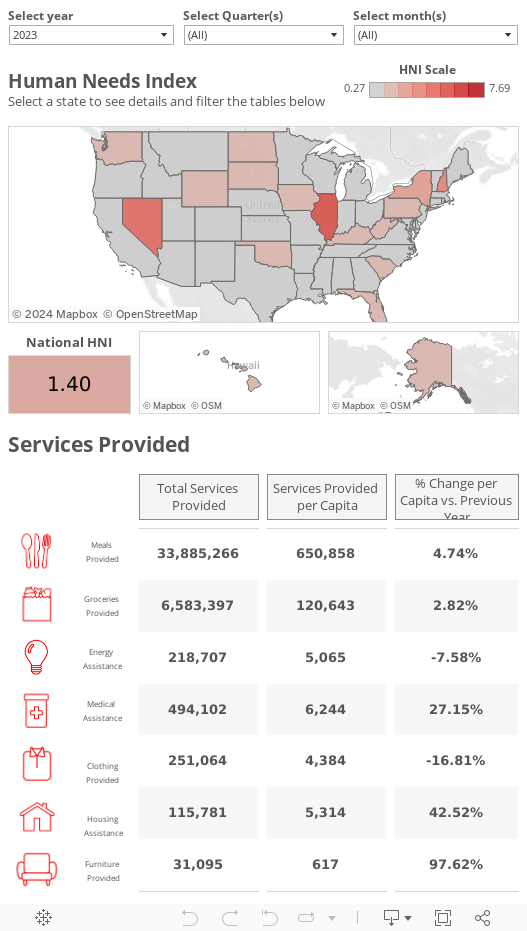
National Map
Measuring Poverty
Official national poverty data have long been calculated using a single dimension: income. At best, income statistics provide only a hazy picture of the actual conditions facing the hungry, the homeless, the unemployed, and the underemployed.
The HNI is a multidimensional way to measure poverty and its effects. The key lies in the street-level knowledge of The Salvation Army, one of the country’s largest nonprofits delivering a safety net of services to those in need.
Published quarterly and developed from data amassed since 2004, the HNI provides the clearest illumination yet of trends in poverty and vulnerability. It is a critical new tool for policy makers, social services providers, and researchers. Sign up for email updates.
Insights and Analysis
Salvation Army Data Collection
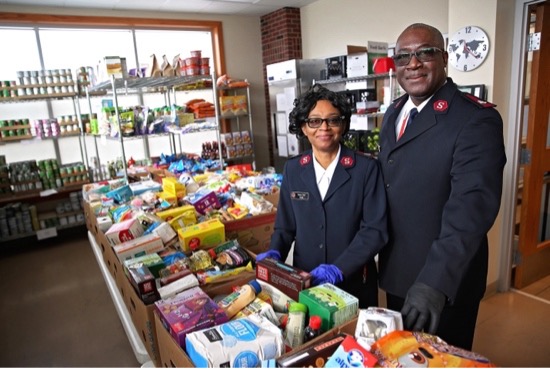
In addition to community outreach and support, The Salvation Army collects high-quality data on poverty-related social services provided in thousands of communities. As the only social service organization with a presence in nearly every ZIP code, it answers the call for increasingly accessible and rigorous data from nonprofit organizations to better illuminate trends in poverty over time.
The Human Needs Index – a Six-Fold Picture
To provide a pathway through which the actual conditions of communities and individuals in poverty can be improved, the HNI analyzes six indicator variables identifying the following kinds of assistance:
- Meals
- Groceries
- Housing (mortgage and rent payment)
- Clothing
- Furniture
- Energy bills
The result is a comprehensive measure and score of need that can track changes in need-based demand month by month. These two advantages – specificity and immediacy – set the HNI apart from other measures.
Tracking the Trend Lines
The HNI measures need in the United States since 2004, suggesting ways public policy and social services can be used in the future to more precisely target human needs in an ever-changing society and economy.
National Perspective
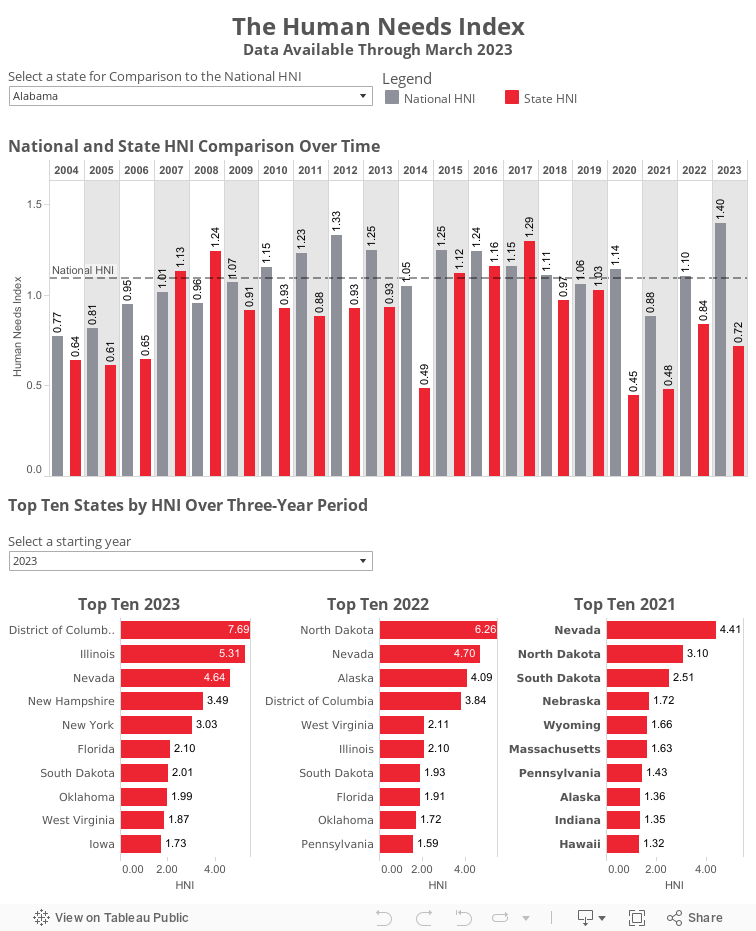
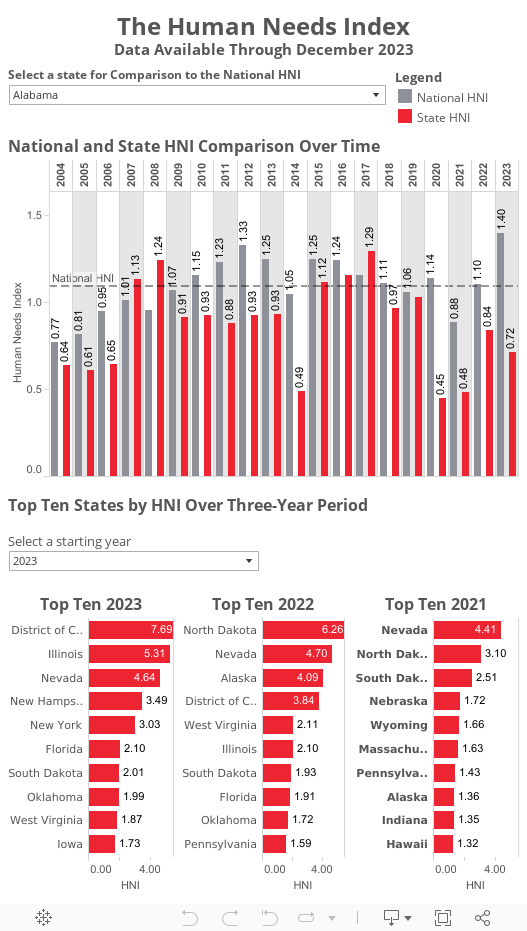
The national HNI scores represent the degree of poverty-related need for the U.S. as a whole.
The scale of the HNI begins at 0, indicating a minimum level of need. Its lowest point was in 2004 (.78). The HNI reached its highest level in 2012 (1.33) and began to trend downward in 2013 (1.25) and 2014 (1.05) before an increase of need in 2015 (1.25). The HNI remained relatively even through 2016 (1.24) and dropped regularly between 2017 (1.15), 2018 (1.03), and 2019 (1.01).
Regional Perspective
Regional HNI scores over time suggest unique patterns based on geographical location, which are likely the result of economic challenges such as inflation and the length of recovery time needed in different states. In addition, regional HNI scores appear to be sensitive to disasters – like hurricanes, tornadoes, and snowstorms – that are geographically endemic but that often also traverse regional boundaries.
How disasters impact the HNI
An important factor to consider when comparing national HNI scores over time is the effect of disasters. While these events are geographically specific, their impact is reflected in the national HNI score, as the elevation of specific poverty-related indicators are associated with services provided during and after disasters, therefore affecting the fluctuation of national HNI scores.
How seasonality impacts the HNI
When monthly HNI scores are viewed, trends suggest that seasonality may be an important factor in anticipating human need. For example, in the 2013-14 winter season, HNI scores began to climb in November; December is markedly the highest score. Scores began to decrease in January and February, which represents the lowest score that season. Scores briefly increased again in March. As demonstrated in this example, the overall trend across years (and regions) illustrates poverty-related need increases late in the calendar year. This increase in need at the end of the year is further demonstrated by the rise in the use of the Supplemental Nutrition Assistance Program (SNAP) benefit, while unmet need is also prominent as evidenced by The Salvation Army’s referral data.
Methodology
The Human Needs Index (HNI) was developed through a rigorous methodology with the goal of informing nonprofit leaders and policymakers about the degree of poverty-related need and measuring the effectiveness of response to need, over time, in specific communities and across the country. To achieve this goal, a standardized index was constructed.
Constructing the HNI was an iterative process that employed empirical evidence, statistical methodologies, and expert consultation. We began this process by developing a conceptual framework for analyzing poverty by identifying appropriate line-item service variables that represented essential basic needs. The selection of variables was based on careful consideration of the academic literature and theoretical constructs associated with measuring poverty and human needs. Overall, we tested more than 450 combinations of 230 organizational service variables to create the HNI – at the national, regional, and state level. We initially selected 21 material assistance and personalized service variables representative of basic human need – that is, the delivery of food, clothing, shelter, or health/well-being services.
Initial tests of these variables were conducted at the national level and by year, although subsequently, data were disaggregated to test variables at the service center site, county, state and territorial levels, and by month. In testing the variables’ ability to measure human need, we relied on external governmental measures of poverty, including the poverty rate, unemployment rate, and the Supplemental Nutrition Assistance Program (SNAP) benefit usage. The statistically significant associations demonstrated with these government measures provided guidance in selecting which variables to include in preliminary modeling.
Next, the 30-member team of statisticians, program officers, economists, and National Advisory Board members from The Salvation Army and Indiana University Lilly Family School of Philanthropy engaged in detailed discussions about which variables dedicated to food, clothing, shelter, or health/well-being services were collected in all states and across all four regions during each year. As a result, three variables (Meals Provided, Clothing Provided, and Lodgings Provided) were initially selected for preliminary testing against the external government measures, individually and together as a test model. The results revealed positive and significant correlations. Thus, additional variables representing these basic needs were added for further model testing.
In the final iterations of creating the HNI, using the governmental measures as benchmark validation and the 21 material assistance and personalized service variables representative of basic human need, we employed three approaches to weighting variables to determine appropriateness for inclusion or exclusion in the final national and state-level models. The most parsimonious model included three variables representing food, shelter, and health/well-being services. The weighting for this model was based on the geometric mean of the included variables. The second technique was the most analytical and pragmatic, in that it used both theoretical and empirical justifications for the weighting and selection of variables. The initial testing of this approach included five variables representing food, shelter, clothing, and health/well-being services. The third and final approach was also an analytic model that included all 21 variables. This process concluded with the presentation of the six strongest models derived from these distinctive approaches.
Ultimately, the second approach using Principal Components Analysis (PCA) was used to build the HNI because it allowed for both intuitive variable selection as well as statistical confirmation of individual variables’ utility in the overall model measuring human need. Subsequently, to ensure the strongest, most appropriate model was selected, further discussions about, and statistical testing of, the second approach were conducted. This concluding phase testing necessitated the retention of four variables, the removal of one variable, and the addition of three variables. The final model, therefore, includes six (6) line-item variables and demonstrates strong correlations with benchmark data. Another important strength of the final model used to construct the HNI is that it is built from variables representing essential aspects of human need that are measured by The Salvation Army consistently across time and region.
Downloads
Recent Publications, Infographics, or Studies
Handout: Human Needs Index Update
Human Needs Index Fact Sheet 2017
Infographic: About Perceptions Of Poverty Survey
Infographic: About The Salvation Army
FAQ
In constructing the HNI, four key components were identified that, taken together, allow us to measure dimensions of human need in a given geographic area:
- Food Security
- Clothing Assistance
- Health/Well-Being Services
- Housing/Shelter Assistance
The selection of variables was based on careful consideration of the academic literature and theoretical constructs associated with measuring poverty and human needs. Overall, we tested more than 450 combinations of more than 230 organizational service variables to create the HNI – at the national, regional, and state level. The final seven indicator variables selected to include in the HNI are listed and described in the table below:
| HNI Indicator | HNI Indicator Description |
|---|---|
| Meals Provided | All meals provided, whether purchased from another source or served through a Salvation Army facility |
| Groceries Provided | Groceries provided by voucher or distributed through a food pantry or food bank |
| Housing Assistance | The number of rent/mortgage assistance payments to establish and/or maintain an individual/family in their own home |
| Clothing Provided | The number of clothing orders provided |
| Furniture Provided | The number of furniture orders provided |
| Medical Assistance | The number of medical orders provided (i.e., prescriptions) and the number of volunteers/hours served |
| Energy Assistance | The number of energy assistance orders provided and the number of volunteers/hours served |
About The Salvation Army
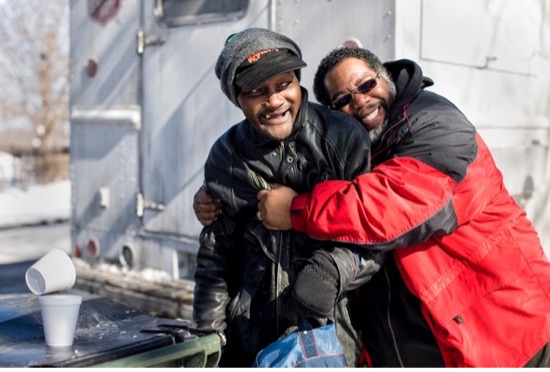
The Salvation Army annually serves more than 25 million people in America, helping them overcome poverty, addiction, and economic hardships through a range of social services. By providing food for the hungry, emergency relief for disaster survivors, rehabilitation for those suffering from drug and alcohol addiction, and clothing and shelter for people in need, The Salvation Army is doing the most good at 7,200 centers of operation around the country. In 2021, The Salvation Army was ranked No. 2 on the list of “America’s Favorite Charities” by The Chronicle of Philanthropy. For more information, visit SalvationArmyUSA.org. Follow us on Twitter @SalvationArmyUS and #DoingTheMostGood.
About The Indiana University Lilly Family School of Philanthropy
The Indiana University Lilly Family School of Philanthropy at IUPUI is dedicated to improving philanthropy to improve the world by training and empowering students and professionals to be innovators and leaders who create positive and lasting change. The school offers a comprehensive approach to philanthropy through its undergraduate, graduate, certificate and professional development programs, its research and international programs and through The Fund Raising School, Lake Institute on Faith & Giving, the Mays Family Institute on Diverse Philanthropy and the Women’s Philanthropy Institute. Follow us on Twitter @SalvationArmyUS, LinkedIn, or Instagram and “Like” us on Facebook.
Contact Us
David Jolley, Communications Manager
The Salvation Army National Headquarters
Phone: 703-299-5543
david.jolley@usn.salvationarmy.org
Adriene Davis Kalugyer, Manager of Public Affairs
Indiana University Lilly Family School of Philanthropy
Phone: 317-278-8972
adrldavi@iupui.edu